
Opened 17 years ago
Closed 17 years ago
#870 closed defect (fixed)
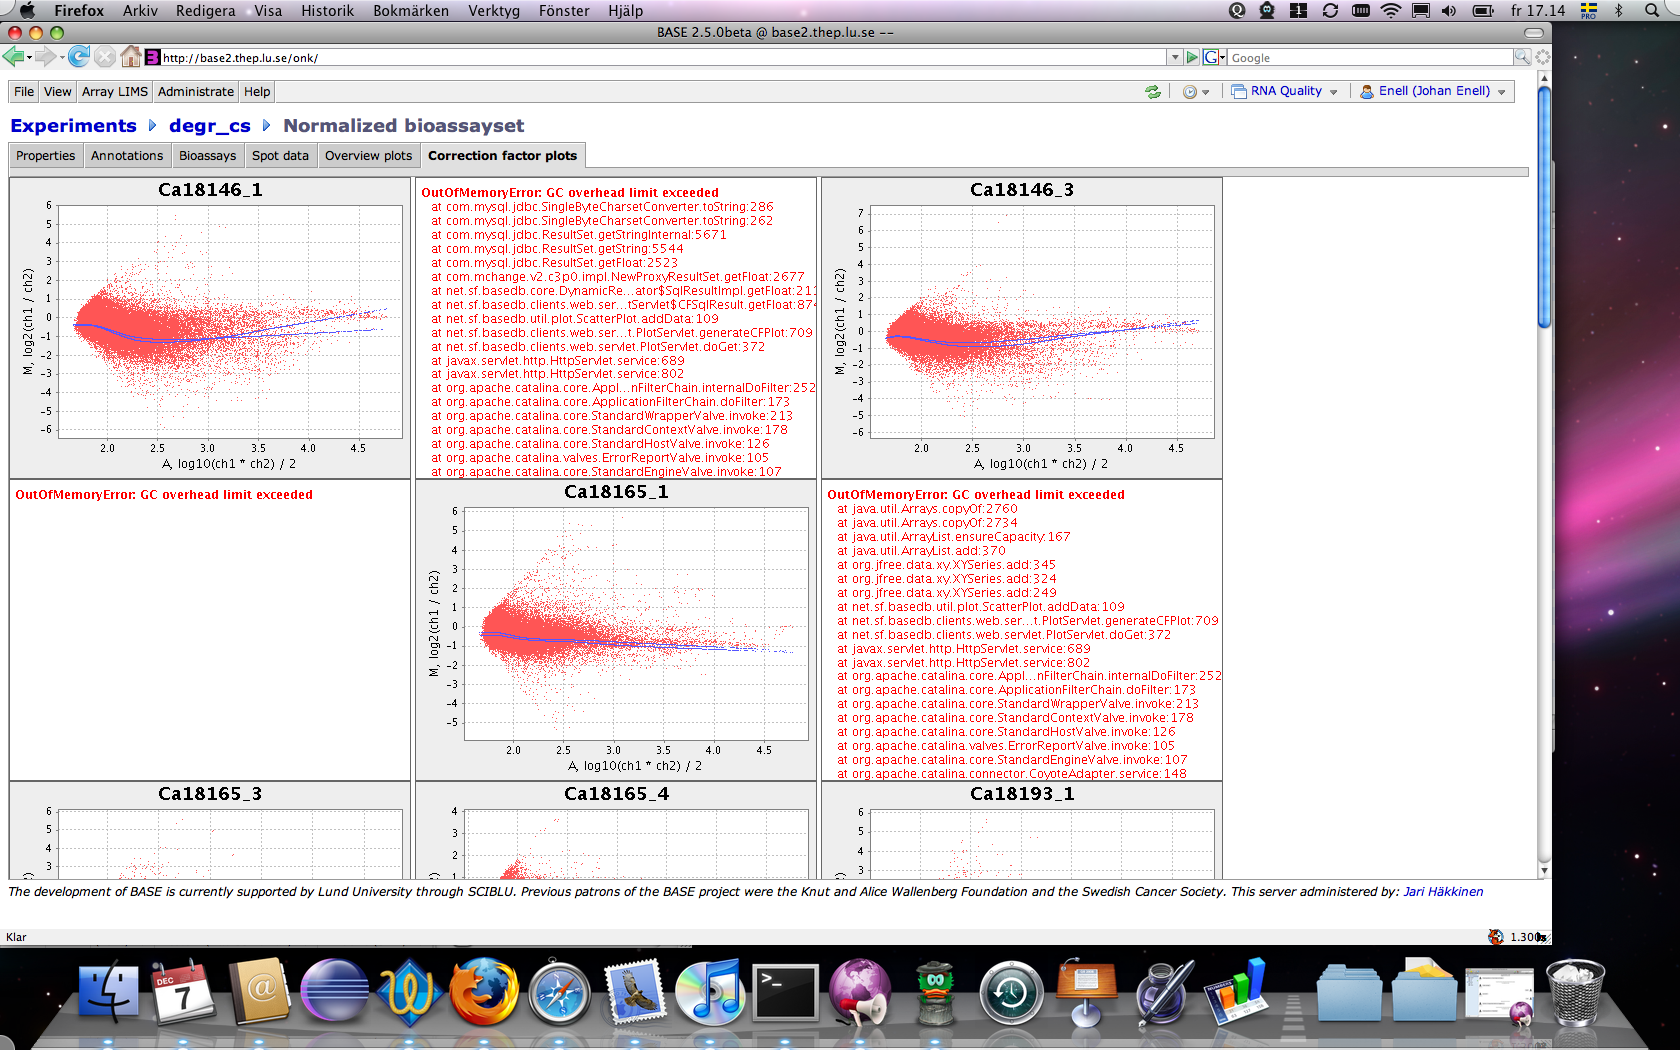
OutOfMemory when creating correction factor plot
| Reported by: | Johan Enell | Owned by: | Nicklas Nordborg |
|---|---|---|---|
| Priority: | minor | Milestone: | BASE 2.5.1 |
| Component: | web | Version: | 2.5.0 |
| Keywords: | Cc: |
Description
I get an OutOfMemoryError when I try to create correction factor plot, see attachment. I think it would be better if the jsp page was a little bit more intelligent and start each plot when the previous is finished instead of trying to create them all on the same time.
Each image is started as a single thread. So maybe one could limit the load by configuring the webserver to not allow that many threads at the same time but I don't think that would be a neat solution.
Attachments (1)
Change History (9)
by , 17 years ago
| Attachment: | OutOfMemory.png added |
|---|
comment:1 by , 17 years ago
comment:3 by , 17 years ago
This is the memory load. When I try to load the about page during the plotting it takes ~400s to load and when it finally shows the page has thrown an OutOfMemory and I can read the memory info from the exception page.
Before
Total: 401.9 MB
Free: 27.5 MB
Max: 444.5 MB

During
Total: 425.0 MB
Free: 35.2 MB
Max: 444.5 MB

After
Total: 438.5 MB
Free: 144.10 MB
Max: 444.5 MB
comment:4 by , 17 years ago
Hmm... afterwards there is still 300MB that is used by something else. It would be interesting to know what is using that much memory. When there is no activity on my development machine the memory usage is normally in the range 50-100MB. I can only think of two things: high activity from other users or a memory leak. If memory is consumed because of high activity then it is probably a configuration issue with Tomcat. The solution in this case would be to either give Tomcat more memory or decrease the number of concurrent threads that may be used. Tomcat 5 allows 200 threads by default, which I think is way too high for BASE. What happens if this value is decreased to say 20? This would still only give about 20MB for each thread if all are used at the same time which may be on the low side.
If it is a memory leak the amount of free memory will probably continue to decrease until there is no memory left and Tomcat has to be restarted.
Link for Tomcat configuration docs: http://tomcat.apache.org/tomcat-5.5-doc/config/http.html
comment:5 by , 17 years ago
There is no activity in the server. I'm the only one that is logged in.
I can se a rather strange pattern in the memory usage by watching the about page. In about 2 min the free memory is reduced from ~190MB to ~100MB when the gc kick in and it all starts over again. Shouldn't the free mem stay constant if there is no activity?
I will check the thread count in tomcat and see if that changes anything.
comment:6 by , 17 years ago
It seems like browsers today have a rather high number for 'max concurrent connections'. Firefox seems to have 24 or 48. In a bioassayset with many bioassays, this means that a high number of requests are hitting the plot applet at the same time. One possible solution is to reduce the number of allowed connections on the server. The drawback is that I don't think the browser will retry to load the image and users will end up with broken images. Another possibility is to add code to the plot servlet that puts incoming requests on hold. The drawback is that parking too many threads will leave no threads for processing other JSP pages (for other users).
So, the best solution is to try to limit this on the browser side. I'll check what is possible to do with Javascript.
comment:7 by , 17 years ago
| Status: | new → assigned |
|---|
comment:8 by , 17 years ago
| Resolution: | → fixed |
|---|---|
| Status: | assigned → closed |
This can have other causes than actually being out of memory. The error message actually means that too much time is spent with garbage collection, but almost no memory can be freed. In most cases this is a sign of low memory, but not always. It could be a Java configuration issue or it could be that some code is calling System.gc() when it is not needed (we had this problem in the migration program and when removing the call everything worked much better).
Have you checked the actual available memory usage from the Configuration tab in the Help -> About menu? It would be useful to know the memory usage before starting the plots, during the plots and after the plots. When I try it out locally (with only 4 bioassay) the used memory actually drops! (hmmm.... could it be that the plotting package is calling System.gc()... I'll check the source code for that package.)
Here is a link to java configuration options: http://java.sun.com/javase/technologies/hotspot/vmoptions.jsp