 Test procedures
Predefined roles
Test procedures
Predefined roles
This document defines a procedure for testing that the predefined roles can perform their work as intended. The main purpose is to weed out permission problems resulting from:
The test procedure also tests that the basic functionality is working:
Here is a summary of the test procedure:
These tests can also be run in automated mode by test programs. This will of course not test the web client, but are useful if one quickly needs to do parts of the test and then continue with, for example, the user or analysis tests on the web.
The data files needed by the tests are NOT included in the subversion repository.
The main reason is that they are too large, and that we don't have permission to
make them publicly available for download. To get the test file you need to be a
core developer. Read the instructions on the
DeveloperInformation
page, Test data section on the BASE web site. The automated
test programs require that file are placed (checked out) in the 'testdata'
directory located in the BASE root directory. NOTE! Some test data files are
bzip-compressed. Use the automatic unpacking that is built-in to BASE when
uploading.
To run the tests do the following:
ant main test.build/test/ directory../test.sh roles [OPTION] <cmds> where
<cmds> is one or more of the following:
all: run all testsroot: run the root user testsadmin: run the administrator testspower: run the power user testsuser: run the regular user testsguest: run the guest user testsOPTION can be none or more of:
-b: if the batch importers should be testedThe root user creates an administrator which is a server-wide admin.
| Name | Login/Password | Quota | Quota group | Membership |
|---|---|---|---|---|
| Admin | admin/admin | Unlimited | - | Roles: Administrator |
The administrator creates users for a project and gives them permissions that are suitable for their role in the project. The administrator also sets up quota and group membership.
| Name | Quota |
|---|---|
| Group A | 1GB |
| Name | Login/Password | Quota | Quota group | Membership | Other |
|---|---|---|---|---|---|
| Power user | power/power | 1GB | Group A | Roles: Power user | - |
| User | user/user | 1GB | Group A | Roles: User | - |
| Guest | guest/guest | 10MB | Group A | Roles: Guest | Multi-user account checked |
| User | Plugins |
|---|---|
| Power user |
|
| Name | Plugin | Configuration values | ||||||||||||||||||||
|---|---|---|---|---|---|---|---|---|---|---|---|---|---|---|---|---|---|---|---|---|---|---|
| Reporters for project A | Reporter importer |
|
||||||||||||||||||||
| GenePix reporter importer (optional) |
Reporter importer |
|
||||||||||||||||||||
| Reporters from Affymetrix annotations file | Reporter importer |
|
||||||||||||||||||||
| Reporters from GTF file | GTF Reporter importer |
|
View -> Reporters page.Import button.auto-detect and then upload
the file plates_and_reporters.mouse.v4.37k.txt.Reporters for project A format should be
found.skip option for the "Missing a required" value
since the file contains rows with empty reporter ID:s.
MG_U74Av2_annot.csv file. This time
also select crop for the "String too long" setting since
the file contains data that is too large for the datbase.
12,488 new reporters should be created.
UCSC_Human_hg19_RefSeqGenes.gtf
file. The default error handling options can be used. This time
38,977 new reporters should be created.
The power user is the typical owner/administrator of a project. The power user sets up common resources used in the project, such as hardware, software, protocols, file formats and annotation types. In this case the power user is also responsible for managing the LIMS.
| Name | Members |
|---|---|
| Project A | Groups: Group A (Use permission) |
| Name | Type | Unit | Interface | Values | Item types |
|---|---|---|---|---|---|
| Drug resistance [A] | String | - | radiobuttons | high, medium, low | Biosource |
| Time [A] | Integer | Hour | text box | - | Sample |
| RIN [A] | Float | - | text box | - | Extract |
| Dye swap [A] | Boolean | - | - | - | Raw bioassay |
| PMT gain [P] | Float | Volt (Electric potential) | - | - | Derived bioassay |
| Name | Item type | Push annotations to parent |
|---|---|---|
| Quality control | Extract | Yes |
| Name | Type | Comment |
|---|---|---|
| Sampling A | Sampling | |
| Extraction A | Extraction | |
| Labeling A | Labeling | |
| Library preparation A | Library preparation | |
| Hybridization A | Hybridization | |
| cBot Settings A | Cluster generation | |
| Scanning A | Scanning | Select 'PMT gain' as a protocol parameter. |
| HiSeq Settings A | Sequencing | |
| TopHat Settings A | Alignment | |
| Feature extraction A | Feature extraction | |
| Cufflinks Settings A | Feature extraction | |
| Printing A | Printing |
| Name | Type |
|---|---|
| Hybridization station A | Hybridization station |
| cBot A | Cluster generator |
| HiSeq 2000 A | Sequencer |
| Scanner A | Scanner |
| Print robot A | Print robot |
| Name | Type |
|---|---|
| Software A | Feature extraction |
| Name | Properties |
|---|---|
| Template A | External ID, ID, Version, Sequence, Gene symbol |
| Name | Biomaterial type | Well lock mode |
|---|---|---|
| Bioplate type A | Any | Unlocked |
| Name | Plugin | Configuration values | ||||||||||||||||||||||||||||||||||||||||||||||||||||||||||||||||||||||
|---|---|---|---|---|---|---|---|---|---|---|---|---|---|---|---|---|---|---|---|---|---|---|---|---|---|---|---|---|---|---|---|---|---|---|---|---|---|---|---|---|---|---|---|---|---|---|---|---|---|---|---|---|---|---|---|---|---|---|---|---|---|---|---|---|---|---|---|---|---|---|---|---|
| Plates for project A | Plate importer |
|
||||||||||||||||||||||||||||||||||||||||||||||||||||||||||||||||||||||
| GenePix feature importer (optional) |
Reporter map importer |
|
||||||||||||||||||||||||||||||||||||||||||||||||||||||||||||||||||||||
| GTF features for project A | GTF reporter map importer |
|
||||||||||||||||||||||||||||||||||||||||||||||||||||||||||||||||||||||
| Raw data for project A | Raw data importer |
|
||||||||||||||||||||||||||||||||||||||||||||||||||||||||||||||||||||||
| Raw data for project A (dye-swap) | Raw data importer |
|
| File format | Annotation | Value |
|---|---|---|
| Raw data for project A | Dye swap | false |
| Raw data for project A (dye swap) | Dye swap | true |
| Name | Geometry |
|---|---|
| Plate type A | 384-well (16 x 24) |
Array LIMS -> Plates page.Import button.auto-detect and select
the file plates_and_reporters.mouse.v4.37k.txt.Plates for project A format should be
found.| Plate type | Plate type A |
| Plate name prefix | Plate A |
| Plate name padding | 4 |
| Name | Platform/Variant | File(s) |
|---|---|---|
| Array design A | Generic | Print map: mouse/printmap.mouse.v4.37k.tam |
| Affymetrix A | Affymetrix | CDF file: affymtrix/cdf/MG_U74Av2.cdf |
| RefSeqDesign A | Sequencing/Expression-like | GTF ref-seq file: sequencing/UCSC_Human_hg19_RefSeqGenes.gtf |
Or
Import array designs with the ArrayDesignImporter plug-in.
/home/power/, upload them if notImport button on the array design list page.arraydesign_out.txt and set
the parsing parameters with help of the Auto generate button on the Column mapping
tab.Finish button on the third wizard-page.
Array design A with plates. Select the imported plates (plate names starting
with Plate A) and sort them in the correct order (as indicated by their names).
Import button when viewing properties for the array design.auto-detect and use the file
printmap.mouse.v4.37k.tam.Print map importer plug-in should be
found.Import features to RefSeqDesign A:
Import button when viewing properties for the array design.auto-detect and use the file
UCSC_Human_hg19_RefSeqGenes.gtf.GTF reporter map importer plug-in should be
found. Select the GTF features for project A format.
Project A project. On the Defaults
tab, set the following defaults. NOTE! Most of the items in this
list should already be registered as default items if the
'Add as project default' option was used when creating the new items.
| Setting | Value(s) |
|---|---|
| Raw data type | Genepix |
| Platforms |
Generic Affymetrix |
| Platforms variants | Sequencing / Expression-like |
| Array designs |
Array design A Affymetrix A RefSeqDesign A |
| Protocols |
Sampling A Extraction A Labeling A Library preparation A Hybridization A cBot Settings A Scanning A HiSeq Settings A TopHat Settings A Feature extraction A Cufflinks Settings A Printing A |
| Hardware |
Hybridization station A cBot A HiSeq 2000 A Scanner A Print robot A |
| Software |
Software A TopHat Cufflinks |
| Name | Array design | Print robot | Protocol |
|---|---|---|---|
| Array batch A | Array design A | Print robot A | Printing A |
| Affymetrix batch A | Affymetrix A |
Or
Import array batches with the ArrayBatchImporter plug-in.
Import button on the array batch list page.Nextarraybatch_out.txt and set the parsing parameters
with help of the Auto generate button on the Column mapping
tab.Finish button on the third wizzard-page.
Create slides
wizard.
| Name | Array batch | Quantity |
|---|---|---|
| Array slide A. | Array batch A | 4 |
| Affymetrix slide A. | Affymetrix batch A | 3 |
Or
Import array slides with the ArraySlideImporter plug-in.
Import button on the array slide list page.Nextarrayslide_out.txt and set the parsing parameters
with help of the Auto generate button on the Column mapping
tab.Finish button on the third wizzard-page.
The user is a typical worker in the project. The user does the actual experimentation in the lab, which includes collecting samples, doing extraction, labeling and hybridizations. The user also scans and analyses the raw data resulting from the images. Inserting items can be done in two different ways, .
Project A project.
| Name | Plate geometry | Bioplate type |
|---|---|---|
| Bioplate A | 96-well (8 x 12) | BioPlate type A |
Import button on the list page.NextAuto generate button on the Column mapping tab.
| Itemtype | File |
|---|---|
| Biosource | biosource_out.txt |
| Samples | sample_out.txt |
| Extracts (including labeled extracts and libraries) | extract_out.txt |
| Physical bioassays (hybridizations, flow cells) | physicalbioassay_out.txt |
| Derived bioassays (scans, assemblys) | derivedbioassay_out.txt |
| Raw bioassays | rawbioassay_out.txt |
\Name\
is needed in the column mapping. The annotation column should be selected by default in
the second wizard-step.
Finish button on the third wizard-page.| Name | Annotations | ||
|---|---|---|---|
| Biosource A |
|
| Name | Protocol | Biosource | Bioplate [well] | Annotations | ||
|---|---|---|---|---|---|---|
| Sample A.00h | Sampling A | Biosource A | Bioplate A [A1] |
|
||
| Sample A.24h | Sampling A | Biosource A | Bioplate A [A2] |
|
||
| Sample A.ref | Sampling A | - | Bioplate A [A3] | - |
| Name | Type | Protocol | Parent | Bioplate [well] | Annotations | ||
|---|---|---|---|---|---|---|---|
| Extract A.00h | - | Extraction A | Sample A.00h | Bioplate A [B1] | - | ||
| Extract A.24h | - | Extraction A | Sample A.24h | Bioplate A [B2] | - | ||
| Extract A.ref | - | Extraction A | Sample A.ref | Bioplate A [B3] | - | ||
| Extract A.00h.qc | Quality control | - | Extract A.00h | - |
|
||
| Extract A.24h.qc | Quality control | - | Extract A.24h | - |
|
||
| Extract A.ref.qc | Quality control | - | Extract A.ref | - |
|
| Name | Type | Label | Protocol | Extract | Bioplate [well] |
|---|---|---|---|---|---|
| Labeled extract A.00h | Labeled extract | cy3 | Labeling A | Extract A.00h | Bioplate A [C1] |
| Labeled extract A.24h | Labeled extract | cy3 | Labeling A | Extract A.24h | Bioplate A [C2] |
| Labeled extract A.ref | Labeled extract | cy5 | Labeling A | Extract A.ref | Bioplate A [C3] |
| Labeled extract A.00h (dye-swap) | Labeled extract | cy5 | Labeling A | Extract A.00h | Bioplate A [D1] |
| Labeled extract A.24h (dye-swap) | Labeled extract | cy5 | Labeling A | Extract A.24h | Bioplate A [D2] |
| Labeled extract A.ref (dye-swap) | Labeled extract | cy3 | Labeling A | Extract A.ref | Bioplate A [D3] |
| Library A.00h | Library | - | Library preparation A | Extract A.00h | Bioplate A [E1] |
| Library A.24h | Library | - | Library preparation A | Extract A.24h | Bioplate A [E2] |
| Name | Protocol | Hardware | Array slide | Extracts (position) |
|---|---|---|---|---|
| Hybridization A.00h | Hybridization A | Hybridization station A | Array slide A.1 | Labeled extract A.00h, Labeled extract A.ref |
| Hybridization A.24h | Hybridization A | Hybridization station A | Array slide A.2 | Labeled extract A.24h, Labeled extract A.ref |
| Hybridization A.00h (dye-swap) | Hybridization A | Hybridization station A | Array slide A.3 | Labeled extract A.00h (dye-swap), Labeled extract A.ref (dye-swap) |
| Hybridization A.24h (dye-swap) | Hybridization A | Hybridization station A | Array slide A.4 | Labeled extract A.24h (dye-swap), Labeled extract A.ref (dye-swap) |
| Affymetrix hyb A.1 | Hybridization A | Hybridization station A | Affymetrix slide A.1 | Labeled extract A.00h |
| Affymetrix hyb A.2 | Hybridization A | Hybridization station A | Affymetrix slide A.2 | Labeled extract A.24h |
| Affymetrix hyb A.3 | Hybridization A | Hybridization station A | Affymetrix slide A.3 | Labeled extract A.ref |
| Flow cell A | cBot Settings A | cBot A | - | Library A.00h (1), Library A.24h (2) |
| Name | Parent bioasasay | Parent extract | Hardware/Software | Protocol | PMT gain |
|---|---|---|---|---|---|
| Scan A.00h | Hybridization A.00h | - | HW: Scanner A | Scanning A | 400 V |
| Scan A.24h | Hybridization A.24h | - | HW: Scanner A | Scanning A | 500 V |
| Scan A.00h (dye-swap) | Hybridization A.00h (dye-swap) | - | HW: Scanner A | Scanning A | 600 V |
| Scan A.24h (dye-swap) | Hybridization A.24h (dye-swap) | - | HW: Scanner A | Scanning A | 700 V |
| Affymetrix scan A.1 | Affymetrix hyb A.1 | - | HW: Scanner A | Scanning A | 800 V |
| Affymetrix scan A.2 | Affymetrix hyb A.2 | - | HW: Scanner A | Scanning A | 900 V |
| Affymetrix scan A.3 | Affymetrix hyb A.3 | - | HW: Scanner A | Scanning A | 1000 V |
| Sequenced A | Flow cell A | - | HW: HiSeq 2000 A | HiSeq Settings A | - |
| Arrangement A.00h | Sequenced A | Library A.00h | SW: TopHat | TopHat Settings A | - |
| Arrangement A.24h | Sequenced A | Library A.24h | SW: TopHat | TopHat Settings A | - |
| Name | Platform/Raw data type | Parent bioassay | Parent extract | Array design | Protocol | Software | File(s) |
|---|---|---|---|---|---|---|---|
| Raw bioassay A.00h | Generic/GenePix | Scan A.00h | - | Array design A | Feature extraction A | Software A | Raw data: mouse/genepix.mouse.v4.37k.00h.gpr |
| Raw bioassay A.24h | Generic/GenePix | Scan A.24h | - | Array design A | Feature extraction A | Software A | Raw data: mouse/genepix.mouse.v4.37k.24h.gpr |
| Raw bioassay A.00h (dye-swap) | Generic/GenePix | Scan A.00h (dye-swap) | - | Array design A | Feature extraction A | Software A | Raw data: mouse/genepix.mouse.v4.37k.00h.dyeswap.gpr |
| Raw bioassay A.24h (dye-swap) | Generic/GenePix | Scan A.24h (dye-swap) | - | Array design A | Feature extraction A | Software A | Raw data: mouse/genepix.mouse.v4.37k.24h.dyeswap.gpr |
| Affymetrix raw A.1 | Affymetrix | Affymetrix scan A.1 | - | Affymetrix A | Feature extraction A | Software A | CEL file: affymetrix/E-TEST-1.ebi.ac.uk/jos1761.cel |
| Affymetrix raw A.2 | Affymetrix | Affymetrix scan A.2 | - | Affymetrix A | Feature extraction A | Software A | CEL file: affymetrix/E-TEST-1.ebi.ac.uk/jos1762.cel |
| Affymetrix raw A.3 | Affymetrix | Affymetrix scan A.3 | - | Affymetrix A | Feature extraction A | Software A | CEL file: affymetrix/E-TEST-1.ebi.ac.uk/jos1763.cel |
| SeqRaw A.00h | Sequencing/Expression-like/Cufflinks | Arrangement A.00h | Library A.00h | RefSeqDesign A | Cufflinks Settings A | Cufflinks | FPKM tracking file: sequencing/dataset1_norm1/isoforms.fpkm_tracking |
| SeqRaw A.24h | Sequencing/Expression-like/Cufflinks | Arrangement A.24h | Library A.24h | RefSeqDesign A | Cufflinks Settings A | Cufflinks | FPKM tracking file: sequencing/dataset2_norm1/isoforms.fpkm_tracking |
| Name | Raw data type | Raw bioassays | Experimental factors |
|---|---|---|---|
| Experiment A | GenePix | Raw bioassay A.00h, Raw bioassay A.24h, Raw bioassay A.00h (dye-swap), Raw bioassay A.24h (dye-swap) |
Drug resistance, Time, RIN, Dye swap, PMT gain |
| Affymetrix A | Affymetrix | Affymetrix raw A.1, Affymetrix raw A.2, Affymetrix raw A.3 |
Drug resistance, Time, RIN, PMT gain |
| Sequence A | Cufflinks | SeqRaw A.00h, SeqRaw A.24h |
Drug resistance, Time, RIN |
Manual import: Go to the properties tab for each raw bioassay. Click on the Import button and use the auto-detect feature to import the raw data. Use the default configuration values except for those listed in the table below.
Batch import: The batch import is started from the properties tab of the experiment. Click on "Import" and use the auto-detect feature with one of the files from the raw bioassays. Use the default configuration values except for those listed in the table below. The batch import should import two raw data sets in one go (since it can only work with a single file format at a time and the dye-swap files uses a different file format). Repeat the batch import a second time to import the remaining two raw data sets.
| Parameter | Value | Mode |
|---|---|---|
| Feature mismatch | smart | both |
| Invalid numeric value | null | both |
| Log file | ~/import.log | batch import |
In both cases, the import should produce the same results as in the table below. When using the batch import mode, the detailed information for each raw bioassay is only found in the log file.
| Raw bioassay | Raw data file | Spots inserted/with null reporter/skipped) | Annotations created |
|---|---|---|---|
| Raw bioassay A.00h | genepix.mouse.v4.37k.00h.gpr | 36,864/632/768 | Dye swap: false |
| Raw bioassay A.24h | genepix.mouse.v4.37k.24h.gpr | 36,864/632/768 | Dye swap: false |
| Raw bioassay A.00h (dye-swap) | genepix.mouse.v4.37k.00h.dyeswap.gpr | 36,864/632/768 | Dye swap: true |
| Raw bioassay A.24h (dye-swap) | genepix.mouse.v4.37k.24h.dyeswap.gpr | 36,864/632/768 | Dye swap: true |
| SeqRaw A.00h | dataset1_norm1/isoforms.fpkm_tracking | 38,293/0/0 | - |
| SeqRaw A.24h | dataset2_norm1/isoforms.fpkm_tracking | 38,293/0/0 | - |
For the Experiment A experiment, it should display several warnings about missing kits and one warning about a missing biosurce on the reference sample.
The Affymetrix A experiment gives some more warnings. Most of them are
related to not using the project default items, missing protocols
and missing hardware. There should also be an error about missing
experimental factor values for the Affymetrix.3
raw bioassay. It is expected since this comes from the reference sample
which doesn't have values for those annotations. The warnings about the
number of spots mismatch is expected since the array design count probesets,
while the raw bioassays count probes.
The Sequence A experiment also has some missing items, and a different raw data type for the experiment and raw bioassays.
Change validation options to reduce the number of warnings:
| Validation option | Setting |
|---|---|
| Project defaults | Set all to Ignore |
| Missing items | Set all to Ignore |
| Annotations - Missing factor value | Warning |
| Other - Raw spots <> features | Ignore |
Now it is time to analyse the data. The analysis test should be done by both a regular user and a guest.
Project A project
Experiment A experiment.
| Clone template | Clone source |
|---|---|
| Template A | Raw data |
| Bioassay set name | Raw bioassays | Formula |
|---|---|---|
| Root bioassay set | all | Mean FG - Mean BG |
| Child name | Filter preset | Expression |
|---|---|---|
| Filtered bioassay set | - | ch(1) > 0 && ch(2) > 0 && rep('id') != null |
| Plugin | Parameters |
|---|---|
| Normalization: Lowess | Accept the default parameters. |
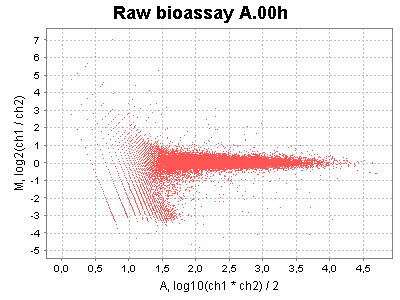
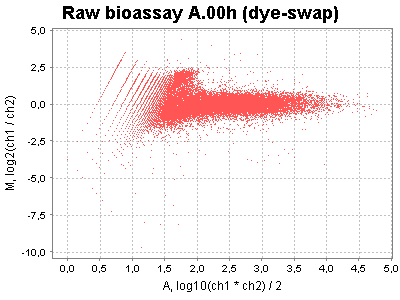
| MA plots | Correction factor plots |
|---|---|
  |
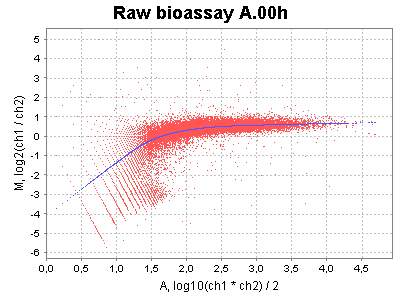 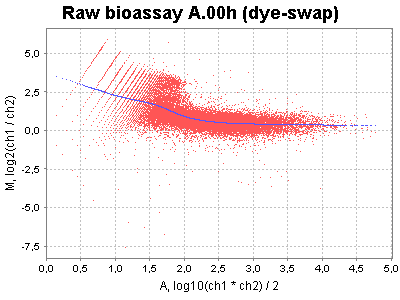 |
Save function
to save one them as a file in the BASE file system, and the Download
function to download a plot to your computer.
| Plot type | Y-axis preset | X-axis preset | Other options | ||||||
|---|---|---|---|---|---|---|---|---|---|
| Scatter plot | M, log2(ch1 / ch2) | A, log10(ch1 * ch2) / 2 | - | ||||||
| Histogram plot | Count | Ratio, ch1 / ch2 |
|
Here are two examples:
| Scatter plot |
|---|
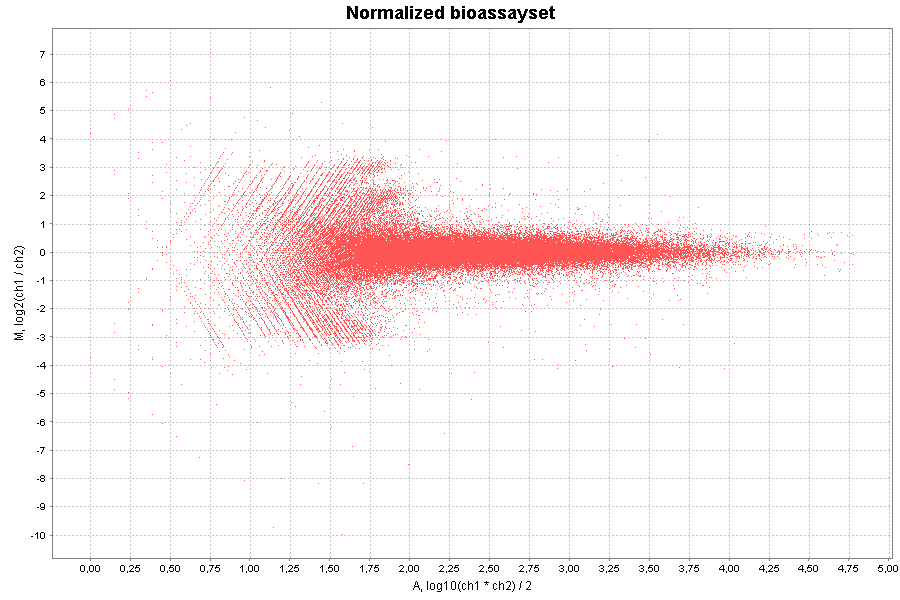 |
| Histogram plot |
|---|
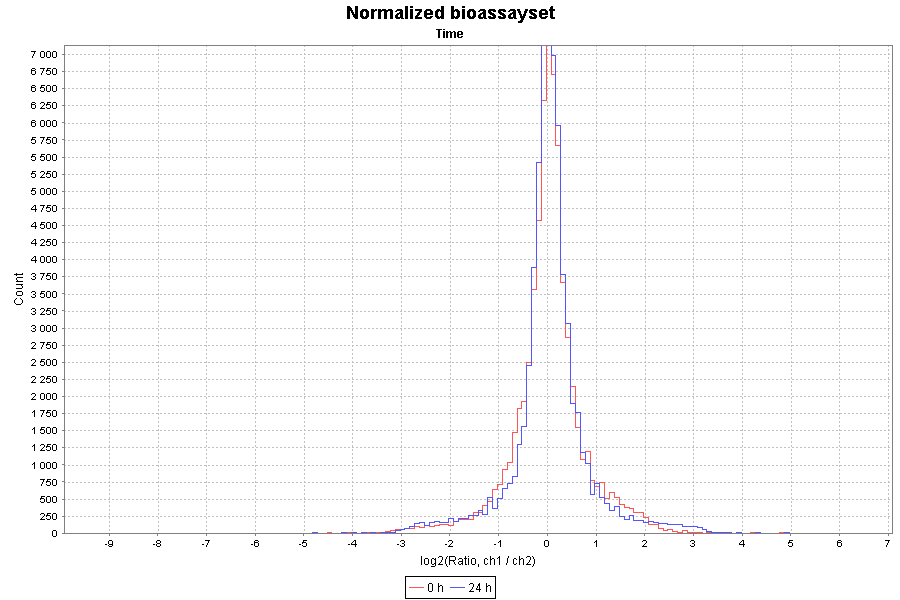 |